Resources

Female (Co-)founded VC deal count %

Source: PitchBook February 3, 2026 European VC female founders dashboard

European venture capital investment trends. 

Median Seed By Founder Gender in the U.S.

Line graph showing trends from 2010 to 2019 for Female-only, Female/Male Co-founded, and Male-only categories. Female-only values start at $200K and generally decrease until 2013, then rise to $460K. Female/Male Co-founded starts at $400K and fluctuates, ending at $630K. Male-only starts at $400K, dips slightly, then increases to $400K.

Source: Crunchbase March 2020

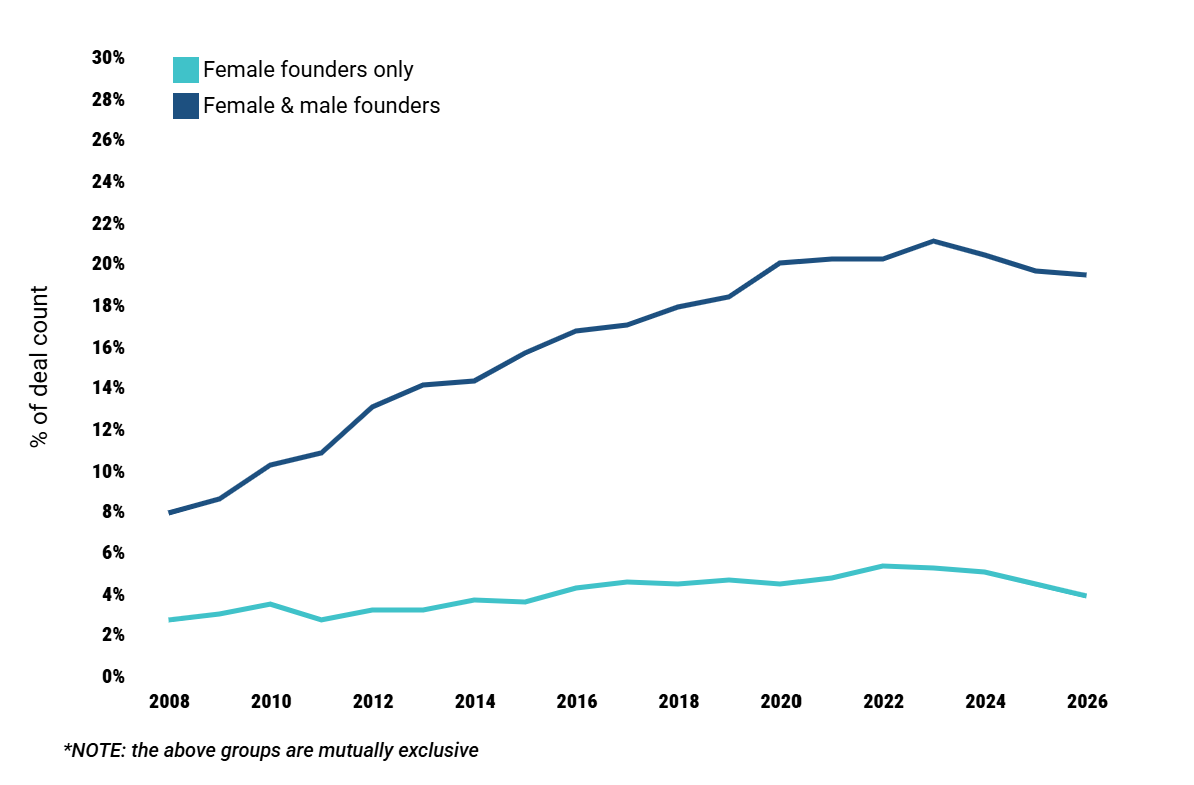
Venture Investments in Female-only and Female/Male Co-founded Companies in the U.S.

Line and bar chart showing increasing venture funding from 2011 to 2019, with a decline in 2020 and 2021. Blue bars represent female/male co-founders, and turquoise bars represent female-only founders. Numbers indicate funding amounts in billions, and the line shows total funding with its peak in 2018.

Source: Crunchbase March 2020

Funding Levels Raised in U.S. at each Funding Stage in 2020

Three line graphs comparing funding amounts in millions of dollars for gender-specific startup companies at seed, early-stage, and late-stage levels. The graphs show median and average funding, with Female-only F founded companies in light blue, Female/Male Co-founded in dark blue, and Male-only F founded companies in teal.

Source: Crunchbase March 2020

Number of Female Founded and Female Co-founded Companies by VC Deal Type in the U.S.

Bar chart illustrating the startup funding stages from 2014 to 2023, divided into Pre/Accelerator/Incubator, Angel, Seed, Early Stage VC, and Later Stage VC, with each stage represented by bars in different colors.

Source: SSTI May 2, 2024 Analysis of PitchBook Data

Number of companies, deals, and capital invested in female-founded and female- co-founded companies by deal type, 2014-2023.

Female Founders VC Deal Count by Major European Cities

Bar chart showing population data for various cities, with London having the highest at 4,944 and Amsterdam the lowest at 370.

Source: PitchBook April 2, 2025 European VC female founders dashboard

Number of companies, deals, and capital invested in female-founded and female- co-founded companies by deal type, 2014-2023.

Deal Count by Founder Mix

A donut chart showing two categories: Female-only with 5,498 and Female and Male with 21,995.

Source: PitchBook April 2, 2025 European VC female founders dashboard

European venture capital investment trends. 

Deal Count by Deal Stage

A donut chart illustrating the distribution of seed or angel investments over time, with four segments labeled 'Angel / Seed,' 'Early VC,' 'Later VC,' showing the number of investments: 12,075, 9,129, and 6,289 respectively.

Source: PitchBook April 2, 2025 European VC female founders dashboard

European venture capital investment trends. 

Female (Co-)founded VC Capital %

Source: PitchBook February 3, 2026 European VC female founders dashboard

European venture capital investment trends.